The Propagation Tools
I am, by no stretch of the imagination, a propagation expert. However, I have learned a little bit about how propagation works and what some of the magic numbers mean. If you want to learn more about propagation, I highly recommend picking up a copy of The NEW Shortwave Propagation Handbook and do a web search in your favorite search engine for '"HF propagation" introduction' (link searches on Google).
The tool that I probably use the most is W6ELProp, written by Shel, W6EL. The basic model of operation is that you give W6ELprop two endpoints (usually your location and the location of some stations that you'd like to work; in the image captured here I've used my home location and Congo (TN) in Africa) and some information about the current propagation conditions (which are available from many sources; I'll discuss that in another post). Oversimplifying a bit, what W6ELProp does is
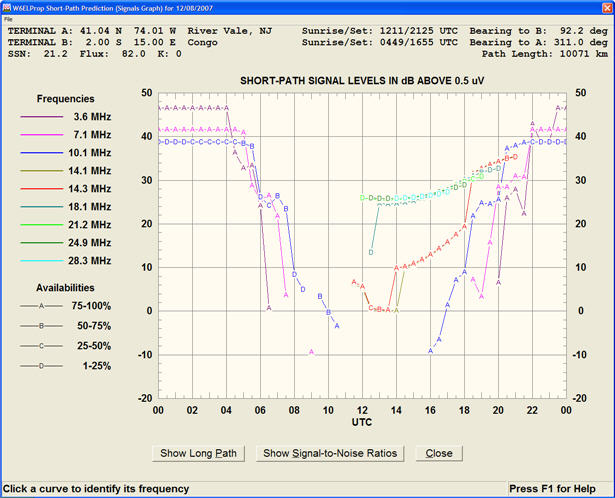 to calculate when you're most likely to be able to make contact with that station and which band you should use. Actually, it shows predictions for all times of day and for whatever bands you've requested. You get to make the decision as to what's the best time to operate. Like other propagation tools, I use this as a guide. I've found times when it's apparently 100% accurate (in other words, I heard the station I was looking for, when and where predicted), but I've also found times when I couldn't hear a peep and, happily, I've heard stations booming in when the predictions said they shouldn't be there at all. Just because a propagation tools says there isn't propagation remember that it is only a prediction based on an imperfect model.
Incidentally, the screenshot here is just one of a number of different ways to display the data. There are tables, graphs, and maps available, all of which have their individual use. The best way to learn which works for you is to play around with it a bit.
The next tool I use is called VOAProp, written by Julian, G4ILO. VOAProp is a graphical front-end for VOACAP, a HF propagation prediction "engine" originally written to support the Voice Of America broadcasts. VOACAP is very powerful, but not very user-friendly, so Julian built this gre
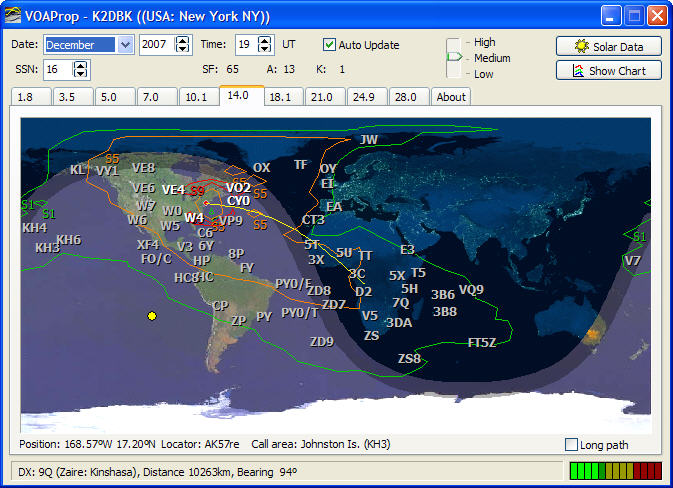 at graphical front end for it. The model for VOAProp is a bit different than W6ELProp: Where W6ELprop is most useful for a scenario where you'd like to know when and where to work a particular location, VOAProp is most useful for answering the question "at a given time and band, what stations am I most like to be able to contact?". You can do the same thing with either of the two tools I've mentioned so far (and in the screen capture shown here, I am pointing specifically to Africa as I did with W6ELProp; the bars on the lower right-hand part of the screen show that decent propagation is predicted, and in fact, I can hear a TN station at this time.) VOAProp has some nice features, including the ability to automatically fetch the propagation information from sources on the Internet (you have to manually enter it into W6ELProp)
The next tool that I use is called HamCAP, written by Alex, VE3NEA. Like VOAProp, HamCAP is
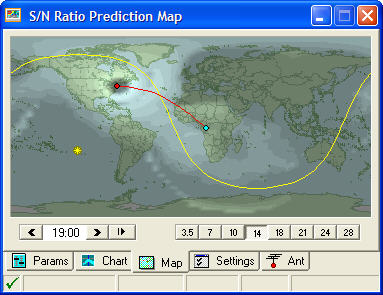 also based on the VOAPROP propagation engine. The graphics in HamCAP show where propagation is available graphically similar to VOAProp. It can be used to produce predictions to a particularly location on top of the general map, which is what's being shown in the screen capture here. (Again, showing the path from K2DBK to TN.) The lighter areas are where propagation is better, and you'll note that there's no skip propagation show local to me on 20 meters, which is what this image shows.
The reason why I first started using HamCAP was because it could produce a set of prediction charts for various times and bands in a form that could be uploaded to a website for a DXpedition. I used it to produce this set of propagation prediction charts for my ZF2DK operation earlier this year. (Click on different times and bands to see what the propagation would have been; remember that the dates for this were at the end of July 2007, so things are likely to be different now.) Incidentally, I want to point out that although I assisted Alex with fixing some minor problems with the display in browsers other than IE, he did all the hard work, I just tweaked a teeny bit of javascript.
I have a couple of final comments about these tools: First, I've really glossed over their capabilities. Download them and try them yourself to see what they can really do. (Psst ... they are all free!) Don't expect to learn everything about them in a few minutes, but the investment in time will be worth it. Second, as I mentioned before, bear in mind that all these tools can do is to predict, using mathematical models. The models aren't perfect, and neither is the data that you'll be feeding into them. So use the output from these tools with that in mind. Just because the tools predict no propagation the only way you'll know for sure is to get on the air.
a nice run down on some I use as well, thanks
ReplyDeletejust wondering about HamCAP, how did you find it? I'm in he process of trying to put some live data on my site and because I have no idea about code and basically I'm having some difficulty working out whats going on.
my site is http://g7kse.co.uk I have a faros page at http://g7kse.co.uk/Faros and I'd like HamCAP to be presented in the same way but with SSN data as a comparison. How does the code process work as the two of them are very different.
Hi Alex - I think I first found HamCAP from some DXpedition that used it. My only involvement from a software standpoint was to fix a bug in the script that displays the maps that caused it not to work with Firefox and Safari (and I think maybe a couple of other browsers.) I contributed the fix back to the author, who has included it in the script. As far as the actual generation of the images, I don't really know anything about that at all, you'd have to ask VE3NEA if there's any way you can do what you want with varying the sunspot number.
ReplyDeleteThe only thing that I can think of would be to run two or more separate sets of graphs, one for each SSN, and put them all up on a web page next to each other.
Thanks for the reply, I've contacted Alex through his yahoo group and I'll see what comes out.
ReplyDeletethere are quite a few propagation tools about and in my experience the information you get out is a fairly good guide. I'd rather match it up with real data from something like Faros but this doesn't seem to exist in the searches I have done. Maybe one day some bright spark will do something like that.
73's
Alex
If you are more into free software you might like this program for linux, It uses the voacap port to linux, the scripts are part of a package called PYTHONPROP. The graphics are stunning and easy to read. emailrgoolsby2@wi.rr.com I can actually make a couple of predictions for you so you can see. 73 robert
ReplyDelete